
How AI Is Transforming Daily Work in Service Teams
Reduce downtime and improve service efficiency with AI-powered troubleshooting. Learn how service teams use ilean to solve problems faster and capture knowledge.
As mentioned in the previous article, based on best practice, there is a need to analyse results at least three times, to check whether the stress results have converged. In most cases, hopefully, the difference in stress values will become minimal. But however, due to stress singularities, the stress values will not converge.
In these scenarios, Nastran In-CAD's comprehensive set of post-processing tools can prove to be helpful. Since there are many post-processing tools available within Nastran In-CAD here will initially discuss Fringe Display plots.
The main benefit of using fringe results is that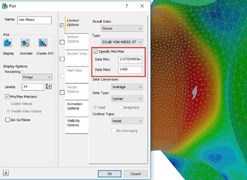 once we alter the maximum value of the legend bar any value higher than the new maximum will be displayed as grey. This can prove to be very useful as we can use this technique to isolate high stresses due to singularities and concentrate on the area of interest.
It is important to no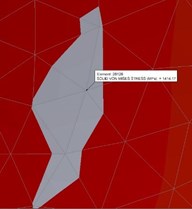 te that altering the maximum value is not about fiddling (non-technical term) with results but is merely about presenting results which are meaningful. Once we have a minimal grey area we can use the probe tool available within Nastran In-CAD to display the maximum value. The benefit of using a fringe display and probes like this is to help locate the maximum value location with ease in the area of interest within the model.
I hope you find this tool helpful, and continue with the next blog in this series 'Exploring corner stress plots'
Reduce downtime and improve service efficiency with AI-powered troubleshooting. Learn how service teams use ilean to solve problems faster and capture knowledge.

Cybersecurity risks are not always caused by sophisticated attacks or major system failures. In many cases, risk builds quietly through everyday habits, overlooked processes, and limited visibility into where data is stored or how users interact with systems.

Learn how to reduce cyber risk through stronger security foundations. This month's bulletin covers home office security, legacy technology risks, vulnerability management, MFA, and cybersecurity best practices.