XY Coordinate Labelling in AutoCAD

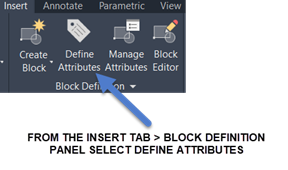
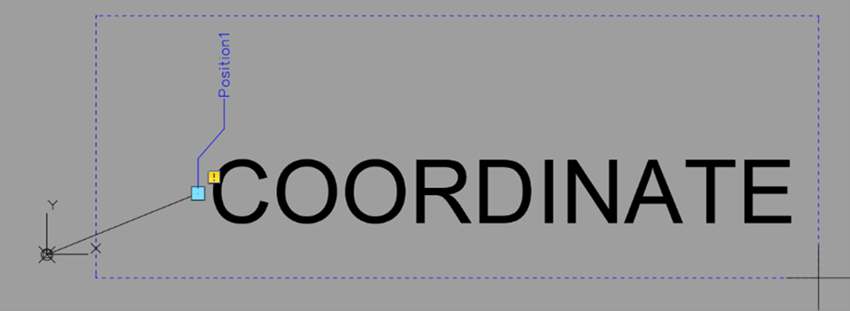
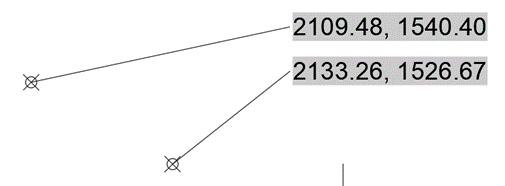
On a recent AutoCAD course, I was asked if AutoCAD has a labelling tool that will extract the XY coordinates from a selected location and show them within the drawing?

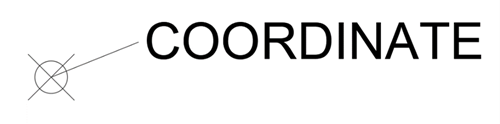
I have previously demonstrated how the Multileader tool combined with the Field tool can achieve this, but it is not exactly swift in its application. So, I thought about coming up with a faster alternative that did not require any programming expertise but instead used standard AutoCAD functionality.

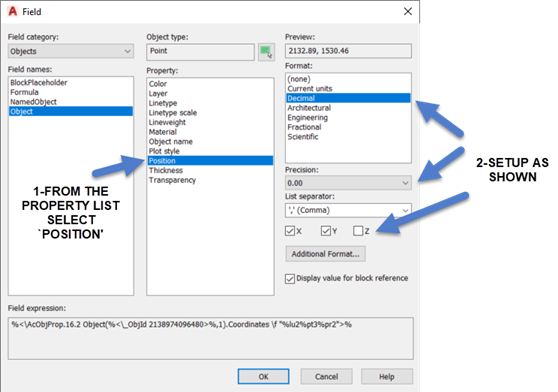
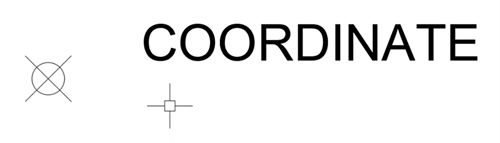
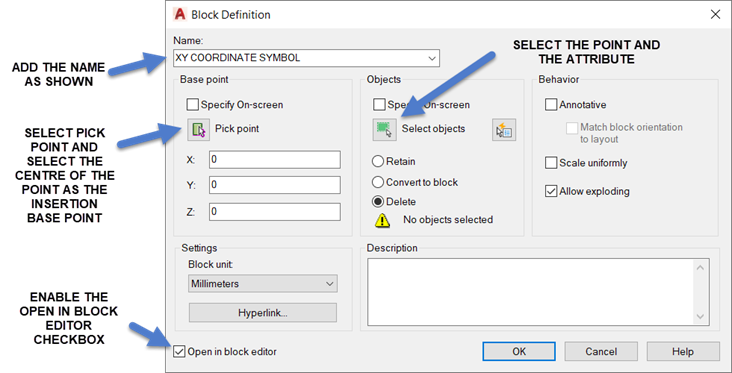
1. To begin we will place a POINT /NODE within an AutoCAD drawing.

2. Now we will Define an Attribute, with an allocated Field, adjacent to this point where we require the XY coordinate to appear.
3. After adding the information as shown below select the Insert Field Icon.
 

4. Within the Field dialog box Field Category dropdown list select 'Objects.'


5. Next, select Object from the Field Names list followed by the Select Object Icon.


6. At the Select Object prompt select the previously drawn POINT /NODE.

7. When the following dialog box appears select Position from the Property list and setup as shown on the right-hand side of this dialog box.

​8. After selecting OK, set the text height to an appropriate size and select OK again, then place the Field adjacent to the POINT /NODE.


9. We will now add a line to be used as an adjustable leader.
10. We are now ready to make this into a Dynamic Block. Select Create Block as shown.
11. Within the Block Definition Dialog Box, after carrying out the following select OK.

12. We will then be within the Block Editor.

13. We are going to configure this block so the leader and text position can be adjusted after insertion.

14. From the Block Authoring Palette select the POINT parameter.

15.  Attach this parameter to the end of the line.

16. We are now going to assign the STRETCH Action to this parameter to enable it to be stretched after this block is inserted. From the Block Authoring Palette activate the Actions tab and select Stretch.

 
17. When asked to Specify first corner of stretch frame, place frame as shown below:

18. When asked to Select objects select the Line and the Attribute and press Enter.

19. We are now ready to Close the Block Editor.

20. Save the Changes to XY Coordinate Symbol.

21. We are now ready to insert the block to see if it works as expected. From the Insert Tab > Block Panel select the Insert Tool and from the Block Gallery choose XY COORDINATE SYMBOL.

22. Place a couple of these blocks and each time the Edit Attributes Dialog Box appears select OK to accept the default values.


23. If these symbols are moved and a REGEN executed, the XY values will automatically update. Also, when a symbol is selected, a Grip will appear at the end of the line adjacent to the coordinate. This can be used to lengthen the leader and reposition the coordinate.

24. So, hopefully, if you have followed the instructions correctly, we now have a labelling tool to extract the XY coordinates from a selected location and show them within the drawing.

If you would like to brush up on your AutoCAD skills and make the most of its tools, explore our Essentials and Advanced AutoCAD courses.

For more information please contact us on 0345 3701500 or email info@symetri.co.uk

5 Ways Chaos Is Using AI to Transform Design Visualisation

28 January 2026

Artificial intelligence is reshaping the way Architects, Designers, and Visualisation professionals bring ideas to life. Chaos, a global leader in rendering and visualisation technology, is at the forefront of this transformation. By integrating AI into its ecosystem of tools - Veras, Enscape, V-Ray, Corona, and Vantage - Chaos is streamlining workflows, accelerating creativity, and redefining what’s possible in design visualisation. This blog explores 5 ways Chaos solutions are supporting AI technology.

Chaos V-Ray vs Chaos Corona: Which Renderer Fits Your Workflow?

21 January 2026

Visualisation has changed dramatically over the past twenty five years. With so many powerful tools now available, choosing the right rendering engine has become a crucial decision for architects, designers, and visualisation specialists. Among the leading options, Chaos offers two standout solutions - Chaos V-Ray and Chaos Corona - each delivering exceptional photorealism in its own way. This blog outlines how they compare.

Including Visualisation as Part of Your BIM Strategy

19 January 2026

I am sure we have all heard the question “are you a visual learner” at some point, this is because today there is a greater appreciation that most of us learn and understand the world around us, including new concepts more easily via visuals.