
How AI Is Transforming Daily Work in Service Teams
Reduce downtime and improve service efficiency with AI-powered troubleshooting. Learn how service teams use ilean to solve problems faster and capture knowledge.
Carrying on from the previous article I will continue discussing about centroidal results within Nastran In-CAD. Below is an example of centroidal results from different elements.
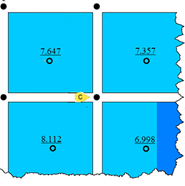 So, if we look @ Node C we can have any of the following values displayed.
Maximum option 8.112
Minimum option 6.998
Average option (7.647+7.357+8.112+6.998)/4 = 7.529
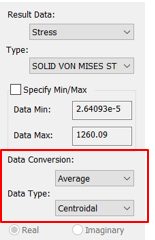
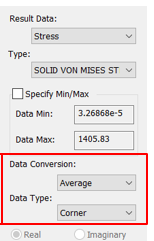
Again, in an ideal world, we should also look for less than a 10% difference between corner average and centroidal average results in the area of interest as another sanity checks for convergence of results.
In the picture below, we can see the stress results are above 10% due to stress singularities present in the model so do take care interpreting results. In other words, the maximum and minimum values are not in the same location. In these situations, using fringe displays and probes can prove to be useful as mentioned in the previous articles.
I hope you found this article useful, I will discuss Safety Factor plots within Nastran In-CAD in my next blog.
Reduce downtime and improve service efficiency with AI-powered troubleshooting. Learn how service teams use ilean to solve problems faster and capture knowledge.

Cybersecurity risks are not always caused by sophisticated attacks or major system failures. In many cases, risk builds quietly through everyday habits, overlooked processes, and limited visibility into where data is stored or how users interact with systems.

Learn how to reduce cyber risk through stronger security foundations. This month's bulletin covers home office security, legacy technology risks, vulnerability management, MFA, and cybersecurity best practices.