
How AI Is Transforming Daily Work in Service Teams
Reduce downtime and improve service efficiency with AI-powered troubleshooting. Learn how service teams use ilean to solve problems faster and capture knowledge.
Nastran In-CAD provides the ability to display stress results using either corner or centroidal results. It is important to note this does not apply to displacement results. In this article we will concentrate on corner stress plots with average being the default stress plot.
Stress Analysis by its very nature provides an approximation of the real-world problem by breaking it down into finite elements as shown below
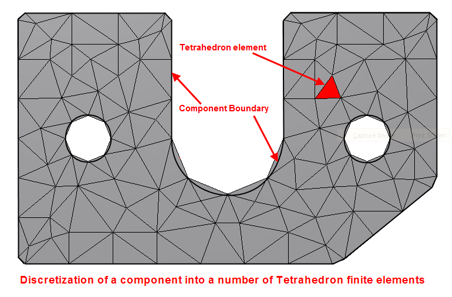
At each element corner (junction) there is more than one result from adjoining elements as illustrated below @ node B. Within Nastran In-CAD you can select whether you want to see the maximum value from all the adjoining elements or the average of all the values at the node.
So, if we look @ Node B we can have any of the following values displayed
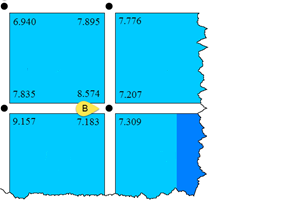 Maximum option 8.574
Minimum option 7.183
Average option (8.574+7.207+7.183+7.309)/4 = 7.568
In an ideal world to obtain convergence in results, in addition to running analyses 3 times, we should expect the difference between minimum and maximum results to also be within 10% in the area of interest. The reason I mention the area of interest is that there may be scenarios when the location of the maximum or minimum value may not be in the same location most likely due to stress singularities. The difference between maximum and minimum results will reduce as the mesh size gets smaller and smaller.
I hope you find this article useful, in my next blog I will talk about centroidal results.
Reduce downtime and improve service efficiency with AI-powered troubleshooting. Learn how service teams use ilean to solve problems faster and capture knowledge.

Cybersecurity risks are not always caused by sophisticated attacks or major system failures. In many cases, risk builds quietly through everyday habits, overlooked processes, and limited visibility into where data is stored or how users interact with systems.

Learn how to reduce cyber risk through stronger security foundations. This month's bulletin covers home office security, legacy technology risks, vulnerability management, MFA, and cybersecurity best practices.