
How AI Is Transforming Daily Work in Service Teams
Reduce downtime and improve service efficiency with AI-powered troubleshooting. Learn how service teams use ilean to solve problems faster and capture knowledge.
I frequently get told that safety factor plots results within Nastran In-CAD are not correct. The reason for this is that safety factor values are calculated in a slightly different way.
The following example best explains this. I will use 200MPa for yield limit for comparison purposes
Safety factor calculation based on average stress at location A is 20.51

Average Stress value = (10+12+9+8)/4 = 9.75
Safety Factor = 200/9.75 = 20.51
Safety factor calculation based on how Nastran In-CAD displays plots at Location A is 20.97.
Safety Factor for Element 1 = 200/10 = 20
Safety Factor for Element 2 = 200/12 = 16.667
Safety Factor for Element 3 = 200/9 = 22.222
Safety Factor for Element 4 = 200/8 = 25
Average Safety Factor = (20+16.667+22.222+25)/4 = 20.97
So, this is the reason why there is a slight difference in the safety factor results. Both results are correct as they have been calculated in slightly different ways. It is entirely up to you which value you take.
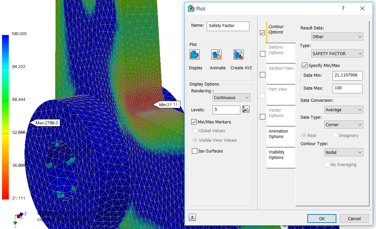
Here a safety factor display is showing a minimum value of 21.11.
Note changing Data Type to Corner or Centroidal will yield the same safety factor result.
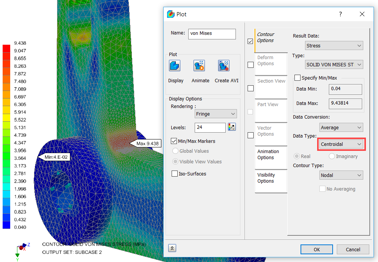
So, for the same model and results if we display the average centroidal results the maximum stress value becomes 9.4381MPa.
So, based on this value the factor of safety (hand calculation) is 21.19.
This is very close to the Safety Factor plot value of 21.11 with a difference of less than 0.5%.
I hope you have enjoyed this series. If you need any further information please complete the form.
Reduce downtime and improve service efficiency with AI-powered troubleshooting. Learn how service teams use ilean to solve problems faster and capture knowledge.

Cybersecurity risks are not always caused by sophisticated attacks or major system failures. In many cases, risk builds quietly through everyday habits, overlooked processes, and limited visibility into where data is stored or how users interact with systems.

Learn how to reduce cyber risk through stronger security foundations. This month's bulletin covers home office security, legacy technology risks, vulnerability management, MFA, and cybersecurity best practices.