Analytical systems within Autodesk’s Revit provide engineers with an option to create analytical water loops, air systems, system zones, and zone equipment rather than creating a physical model to establish values within a mechanical system. Analytical systems also provide an easier and more flexible way to make changes and assess the results of those changes without having to undertake lengthy physical model alterations.
Mechanical Systems Analysis Loads Report
Revit 2022 introduces a new report format for mechanical systems analysis in the form of a Loads Report that is created in the same way as the previous detailed report style. The detailed report is still available to review, and collectively these can be used to understand and evaluate load calculations, equipment selection, sizing, and system simulation, and to review and compare the outcome of potential changes to a design before committing to creating the physical model.
The format and content of the Loads Report in Revit 2022 is an improvement on the original detailed report and provides an easier way to review and evaluate specific information in analytical systems. The report also includes psychrometric information not previously seen in the report.
The report is divided into three separate sections, Zone Load Summary, System Load Summary, and Design Psychrometrics. The user can also choose the units the report is displayed in, and the final report can be printed to pdf.

The Zone Load Summary area of the report presents information about the building envelope, the internal gains, and the systems. As analytical space properties and material thermal properties are altered, the values within any new report generated will reflect those changes. The user can also select the zone equipment then switch between the heating and cooling load information available in the report.
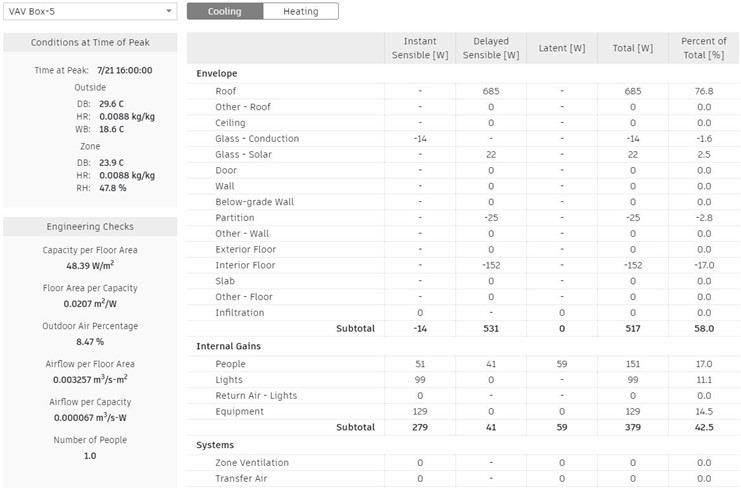
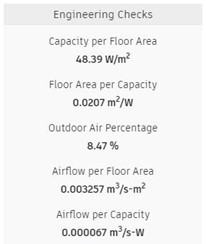
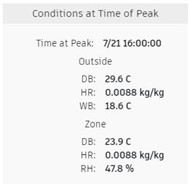
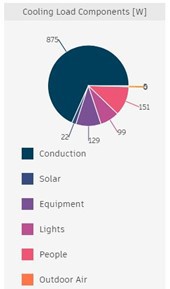
Finally, the user is presented with an overview of the peak environmental conditions and useful engineering checks for heating and cooling loads, such as wet and dry bulb temperature, relative humidity values, outdoor air, and airflow information. A series of pie charts help to graphically display the peak heating and cooling loads, and a breakdown of the contributions from cooling load components such as solar, equipment, and people.
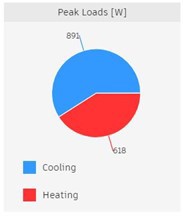
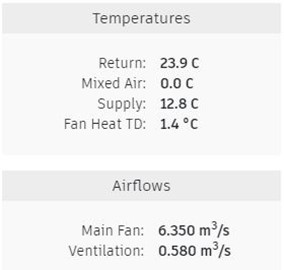
The System Load Summary area of the report is similar to the zone load summary but also includes information on the air temperature at different points in the system e.g. supply and return air, and the flow rates for the main fan and for ventilation.
The Design Psychrometrics section of the report includes a summary table, and a psychrometric chart plotting Information relating to the dry bulb temperature and humidity ratio of air at each point in any system containing a cooling coil. The table below the report displays the remaining information that would be plotted on psychrometric charts.
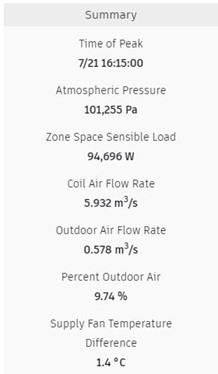
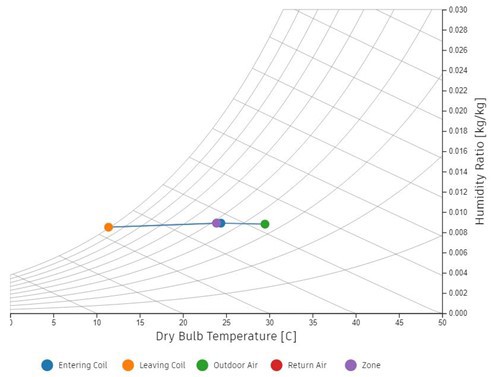

As changes are made to the analytical systems, material thermal properties, or analytical space properties within a Revit project, the subsequent loads report will display the updated heating and cooling loads information for zone loads, system loads, and for the psychrometric information displayed on the graph and in the chart, allowing engineers to receive quick and detailed feedback on potential design changes.
Watch our video below to see these new features and updates in action:

Author
Symetri


